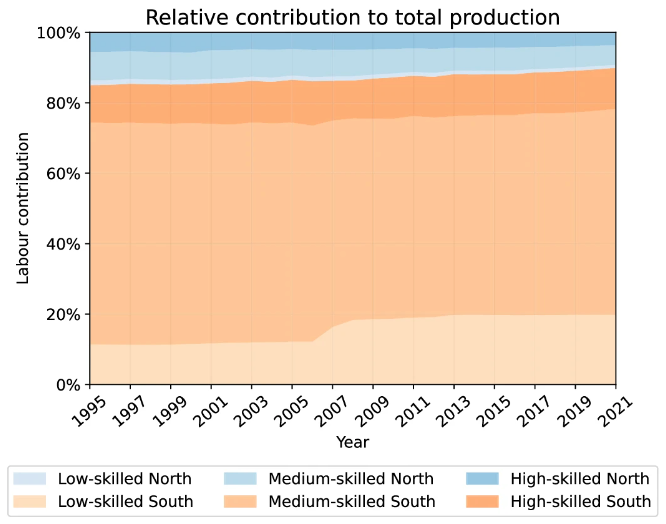
Maybe it’s about measurement, but also look closer, the change is not 2006, it’s 2007. It’s when the financial crisis related to the US real estate bubble hit. Also the x-axis is in percent. So it might just be, that the crash hit the regions harder, whose banks had invested most in the bubble: US and Europe. The apparent rise we see might just be production in the global south staying constant, while falling elsewhere.
Also China started huge investments, but I think most of that was at the end of 2008.
Edit: No, I was wrong. Looks like production shifted from medium skilled south to low skilled south. I have no explanation.