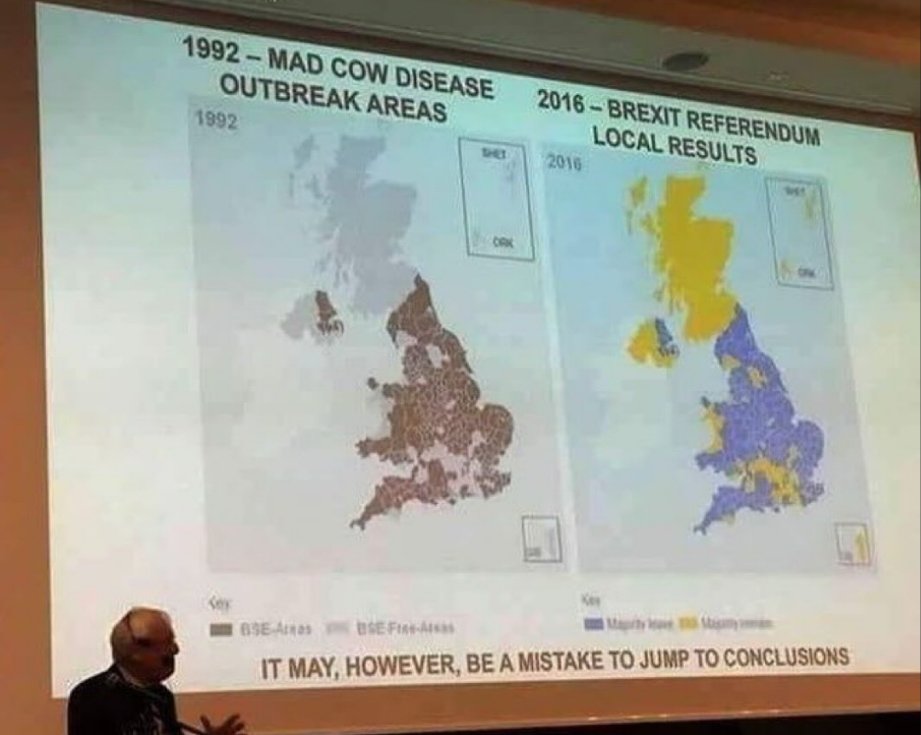
It’s an insubstantial article, but it is the exact same graphic. Everything’s identical except for the legend, date, and color scale, even the spacing of the legend.
The font on the legend is different, however, which you wouldn’t expect if someone had independently mapped both incidents. The font of the year is identical, but it’s reasonable to assume it was added for both maps.


Funny but it’s just satire
It may be true (as in it may be satire), but this site’s fact check is a bit lame. Basically just “trust us, it’s fake”.
It’s an insubstantial article, but it is the exact same graphic. Everything’s identical except for the legend, date, and color scale, even the spacing of the legend.
The font on the legend is different, however, which you wouldn’t expect if someone had independently mapped both incidents. The font of the year is identical, but it’s reasonable to assume it was added for both maps.
A very quick flick through image results shows the EU Referendum map is taken straight from the BBC.
(Edit: I can’t say I’m not disappointed that Snopes didn’t do a better job, since this took me less that five minutes on mobile.)
it says that there’s no way it is true because the mad cow map is just brexit in grayscale, an assessment i agree with
A map of the propagation of an infection would have gradations. Knowing how prevalent the illness is is critical information.
Unlike an election an illness doesn’t win a municipality when exceeding a certain threshold.