The way I interpret that graph of the last 5 years is that at only a couple of points in time did any drops as steep or as large occur except during covid times (exacerbated hugely by Trump) and once in 2023 which I’m not sure what happened but it was a slower fall and the recovery was very strong.
Then funny enough I stumbled on this image (I had saved from a couple weeks ago) when I took this screenshot to show you:
I don’t find it fair to say it only is significant because it’s not visible on a 90 year graph. Times change a lot over decades. Even if you only look at 20 years back, this is a blip you can see and it’s only a couple months in.


The funny part about this is that I feel even more validated when I check a live updates graph of the s and p 500.
See for yourself: https://www.macrotrends.net/2488/sp500-10-year-daily-chart
The way I interpret that graph of the last 5 years is that at only a couple of points in time did any drops as steep or as large occur except during covid times (exacerbated hugely by Trump) and once in 2023 which I’m not sure what happened but it was a slower fall and the recovery was very strong.
Then funny enough I stumbled on this image (I had saved from a couple weeks ago) when I took this screenshot to show you: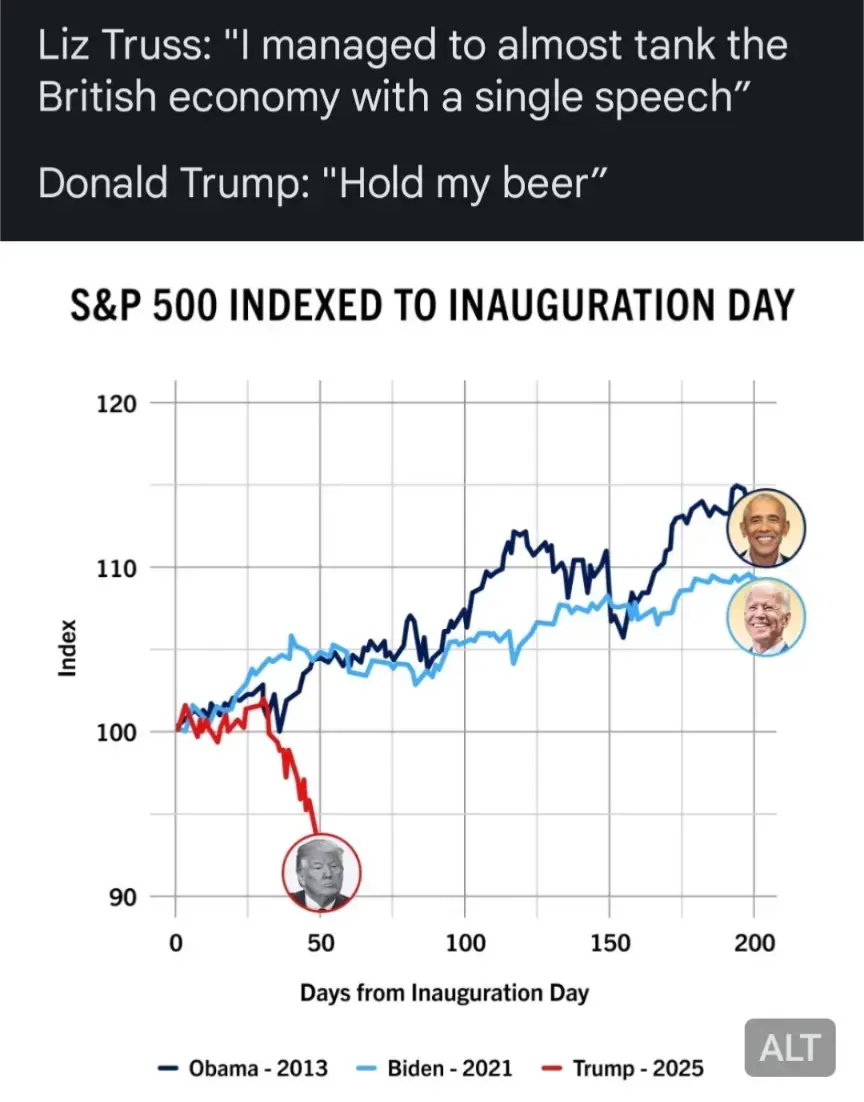
I don’t find it fair to say it only is significant because it’s not visible on a 90 year graph. Times change a lot over decades. Even if you only look at 20 years back, this is a blip you can see and it’s only a couple months in.
https://www.macrotrends.net/2324/sp-500-historical-chart-data
If you look at this data and don’t see it, I don’t know what to tell you.